|
Audi Boost Profile Graphs, also HP/Torque graphs
1992-96 S4 and S6
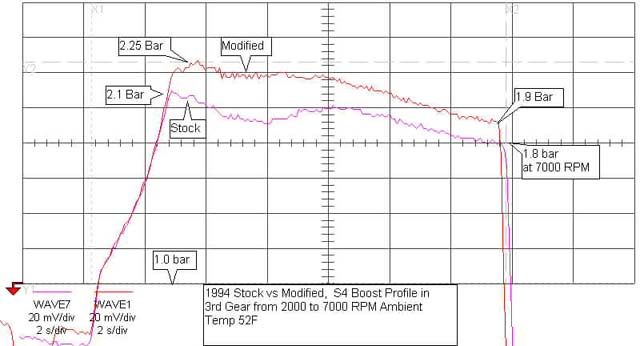
Here is a graph showing the actual boost output for the Stock S4 and from a S4 with a modified ECU (Hoppen Stage I) .
The actual boost output will vary depending on the air temp, fuel quality and altitude.
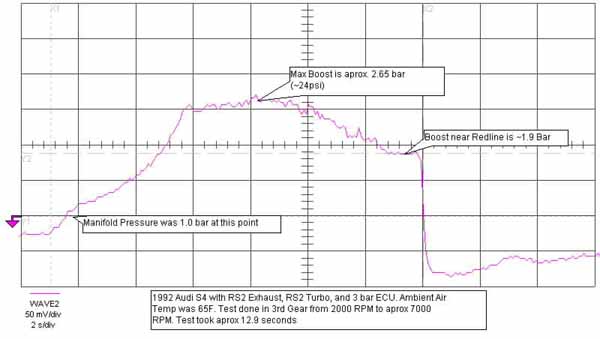
Here is another graph showing the actual boost output from a S4 with a modified 3 Bar ECU, using the RS2 Exhaust Manifold, and the RS2 Turbo. Vehicle has the stock exhaust system with catalytic convertors.
The actual boost output will vary somewhat, depending on the air temp, fuel quality and altitude. The graph was obtained using an electrical pressure transducer, and a portible Oscilloscope. The small rough peaks on the graph, are caused by electrical noise on the Oscilloscope trace.
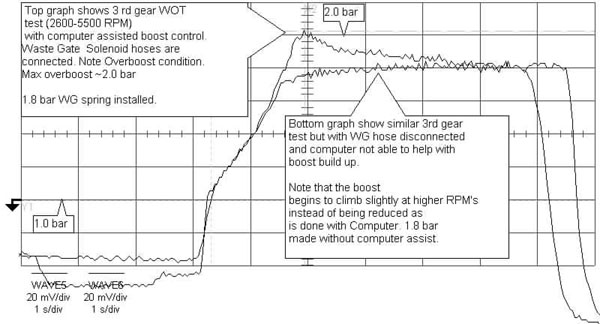
1989 Turbo Quattro with Modified ECU
Modified 1989 200TQ with dual knock sensor MC engine: Boost output profile with and without WG solenoid ECU boost control
|
| About Us Privacy Policy Terms of Use Links Customer Service Safety Information Home |